Healthcare Revenue Leaks That Reduce Collections and Increase Denials
- Anne Scholfield

- 1 day ago
- 6 min read
Most healthcare practices lose between 3% and 7% of their net revenue every year without ever seeing it in a denial report. That is not a billing error. That is a slow, invisible drain that compounds week after week until collections drop and no one can explain why.

The scariest part? Most of these problems never trigger an alert. Payers process the claim, mark it "paid," and move on. Your team sees a green checkmark. But the money that came in is less than what you earned.
What Is Healthcare Revenue Leakage
Healthcare revenue leakage is money you earned but never fully collected. It is different from a denial. A denial shows up in your workflow queue. Revenue leakage hides inside "processed" claims, bundled payments, missed charges, and underpayments that never raise a flag.
Leakage rarely announces itself. It accumulates silently across hundreds of daily transactions, buried inside small errors, mismatched data, or payer requests that never get resolved.
That is what makes it so damaging. By the time it shows up in your AR numbers, the window to recover most of it has already closed.
The Real Cost of Revenue Leakage in Healthcare Practices
Before getting into the problems, understand the scale.
For a practice billing $2M annually, that is $60,000 to $140,000 walking out the door quietly every year.
1. Eligibility Errors at the Front Desk
Almost half of all revenue leakage starts before the patient sees a provider. Front desk teams verify insurance once at intake and never re-check. Insurance plans change. Authorizations expire. Patients switch employers.
When a claim goes out with stale eligibility data, it either denies or pays incorrectly. And because the error happened at the front end, fixing it at the back end takes three times as long. Errors in eligibility and demographics, missing authorizations and intake mistakes create issues before a claim is ever submitted.
Fix: Re-verify eligibility at every visit, not just at intake.
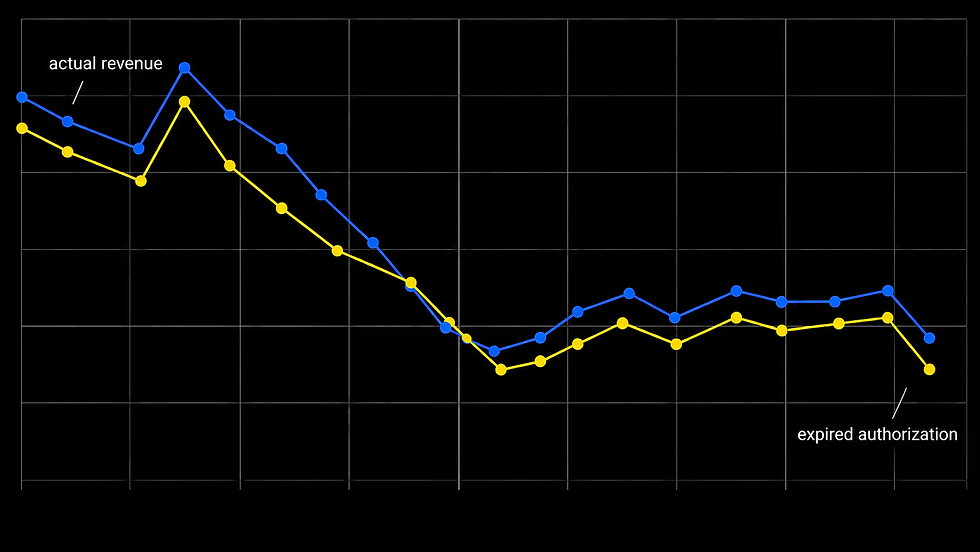
2. Prior Authorization Gaps That Nobody Tracks
Authorization gaps are one of the top causes of avoidable denials in healthcare billing. A clinic delivers services, the authorization expires mid-month and claims go out anyway. The payer denies them. The team reworks them. Half get recovered. The rest get written off.
The fix is a live authorization tracking calendar with 30, 14 and 7-day renewal alerts. If your current billing team cannot show you that calendar in 60 seconds, you have a revenue leakage problem right now.
3. Claim Scrubbing That Misses Payer-Specific Rules
A basic claim scrubber catches obvious errors. It will flag a missing NPI or a wrong date format. What it will not catch is a modifier combination that one specific payer rejects based on their internal adjudication logic.
In 2026, you need a scrubber that knows the payer-specific adjudication rules for every different insurance company. Generic scrubbers pass claims that get silently reduced or denied on the other side.
4. Silent Underpayments on Processed Claims
This one is the most dangerous because it looks like success. The claim is marked processed. The payment posts. No one flags it.
But the amount paid is $15, $30, or $60 less than what your contract guarantees. Multiplied across hundreds of claims a month, that gap becomes tens of thousands of dollars in permanent loss.
A mid-size practice performing 180 visits per month, with modifier reductions of just $35 per encounter across two payers, loses $6,300 per month. That is $75,600 annually. No denial. No rework flag. Just a processed claim at a lower rate.
Fix: Load contracted rates and run a monthly comparison of allowed vs. paid amounts by CPT code and payer.
5. Missed Charge Capture
A billable service happens. Nobody records it. It never becomes a claim. The revenue disappears without ever being attempted.
This is especially common in high-volume settings where providers are moving fast. A follow-up note gets skipped. An add-on procedure is not linked to a charge. Subtle documentation shortfalls or timing issues in high-volume service lines create leakage that compounds quickly.
6. Denials That Get Worked Once and Written Off
Eighty percent of denied claims are never fully reworked. At $1,000 to $5,000 per denial, that is systematic revenue loss most practices absorb without ever measuring it.
A claim denies. Someone resubmits it once. It denies again. The team moves on. The balance gets written off as "uncollectable" when it was actually a fixable coding issue.
This is where a structured denial management process matters. Every denial needs a root cause code. Every root cause needs a workflow owner. Without that, the same errors repeat every month.
7. No Payer-Level AR Visibility
Most practices track total AR. They do not track AR broken down by payer. That means one slow payer can drag the whole number and nobody knows which one to call.
When you can see days-in-AR by payer, the problems become obvious. Payer A is paying in 22 days. Payer B is sitting at 58 days. One of those needs attention today.
Learn how AR management breaks down aging by payer so nothing gets buried in a total figure.
8. Credentialing Gaps That Create Claim Rejections
A new provider joins your practice. Claims go out before credentialing is complete with one specific payer. That payer rejects everything from that provider. The team reworks it after credentialing completes, but timely filing windows close during the wait.
Missing prior authorizations are the single largest cause of avoidable denials and credentialing gaps run a close second because they prevent clean claims from ever being accepted in the first place.
9. Undercoding and Downcoding
Some providers consistently code lower than the visit level supports because they are nervous about audits or simply unsure. Payers also downcode claims on their end and do not always notify you.
Both types lead to the same outcome: you delivered a Level 4 visit and got paid for a Level 3. Repeated across a full patient panel, the annual revenue difference is significant.
Read more about how healthcare revenue cycle management catches coding gaps before they become permanent losses.
10. Patient Balance Leakage
Copays not collected at the time of service. Patient statements that go out once and never follow up. Balances that sit for 90 days and get written off without a call.
Patient collections are often treated as a separate process from insurance billing, but they are part of the same revenue cycle. A practice with a clean claim rate of 98% can still have meaningful leakage on the patient side if the front desk does not collect balances consistently.
11. No Monthly Revenue Cycle Review
This is the one that allows all the others to continue.
Without a monthly review covering denial rate by payer, AR aging, clean claim rate, net collection rate and payment variance, problems stay invisible. Teams are reactive. Issues compound. By the time revenue drops are visible in the bank account, months of leakage have already occurred.
Focus on clean claim rate, first-pass denial rate, days in AR, net collection rate and payment variance by payer. A declining net collection rate paired with rising AR days is typically the earliest sign that leakage is growing beneath the surface.
How Do You Know If Your Practice Has Revenue Leakage Right Now?
Ask these three questions about your current billing process:
Can you see your denial rate broken down by payer and root cause, not just a total number?
Are you running a monthly comparison of what payers paid vs. what your contracts guarantee?
Do you have a live authorization tracking calendar for all active patients?
If the answer to any of those is no, revenue is leaking. The question is only how much.
FAQs
What is the most common cause of healthcare revenue leakage?
Silent underpayments and missed prior authorizations are the two biggest drivers. Underpayments are especially dangerous because claims show as processed, so most teams never investigate them. Running a monthly contracted rate comparison by CPT code and payer is the most direct way to find this leakage.
How do I know if my practice has a revenue leakage problem?
Check three numbers: your denial rate (anything above 5% signals upstream workflow errors), your AR aging past 30 days and your clean claim rate (anything below 95% means rework costs are already eating into collections). If any of those are outside range, a billing audit will show exactly where money is going.
Can revenue leakage be fixed without switching billing software?
Yes. Most revenue leakage comes from process gaps, not technology gaps. Better authorization tracking, payer-level reporting, contracted rate audits and structured denial workflows fix the majority of leakage without requiring a system change.
What a Practice Without Revenue Leakage Actually Looks Like
Denial rate under 5%. AR aging mostly under 30 days. Monthly reports that show payer-level collection variance. An authorization calendar that alerts the team before units expire. Payment posting that flags anything paid below contract.
That is not an ideal. That is what a structured RCM process produces, consistently.
If your current process does not look like that, the gap between what you are billing and what you are collecting is real and it is growing quietly every month.
PaceMave can audit your current billing workflow and show you exactly where revenue is leaking Schedule a billing review today.